So, you gave your class a quiz and you see some information that speaks about statistics. What exactly do the various statistic values mean and how can this information be used to change the way I teach and evaluate classroom learning? The information below will help you with this.
Viewing quiz statistics
View and export quiz statistics and reports to a CSV file for data analysis. The CSV file contains all pertinent information on the quiz so that you can query, sort, and evaluate the data without being connected to D2L Brightspace. In this view, you can see a list of quizzes for your course. The average grade for each quiz displays beside the quiz name.
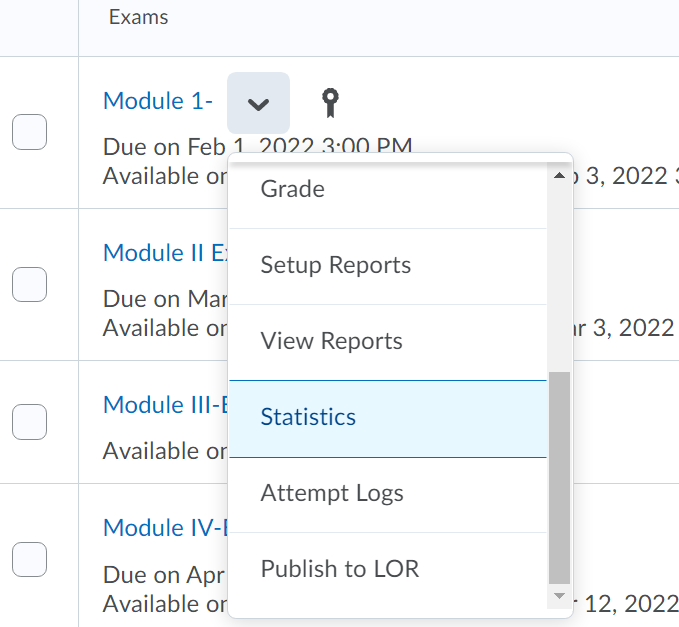
- On the Manage Quizzes page, click Statistics from the context menu of the quiz you want to view.
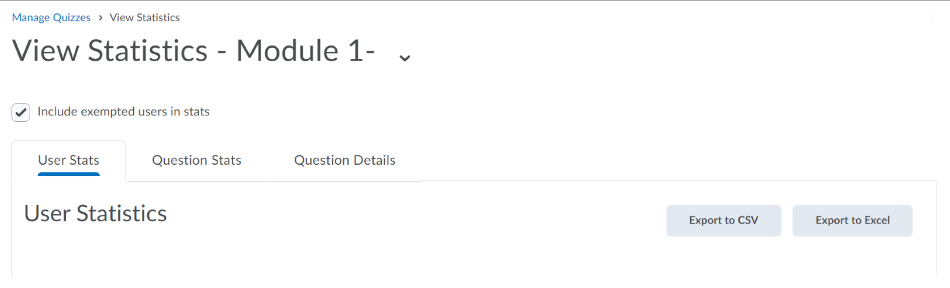
- On the View Statistics page, click the User Stats, Question Stats, or Question Details tabs to view statistics broken down by user or by question.
- Click Export to CSV file if you want to save the quiz statistics on your computer. Note: The system will export the statistics only from the tab you are currently viewing.
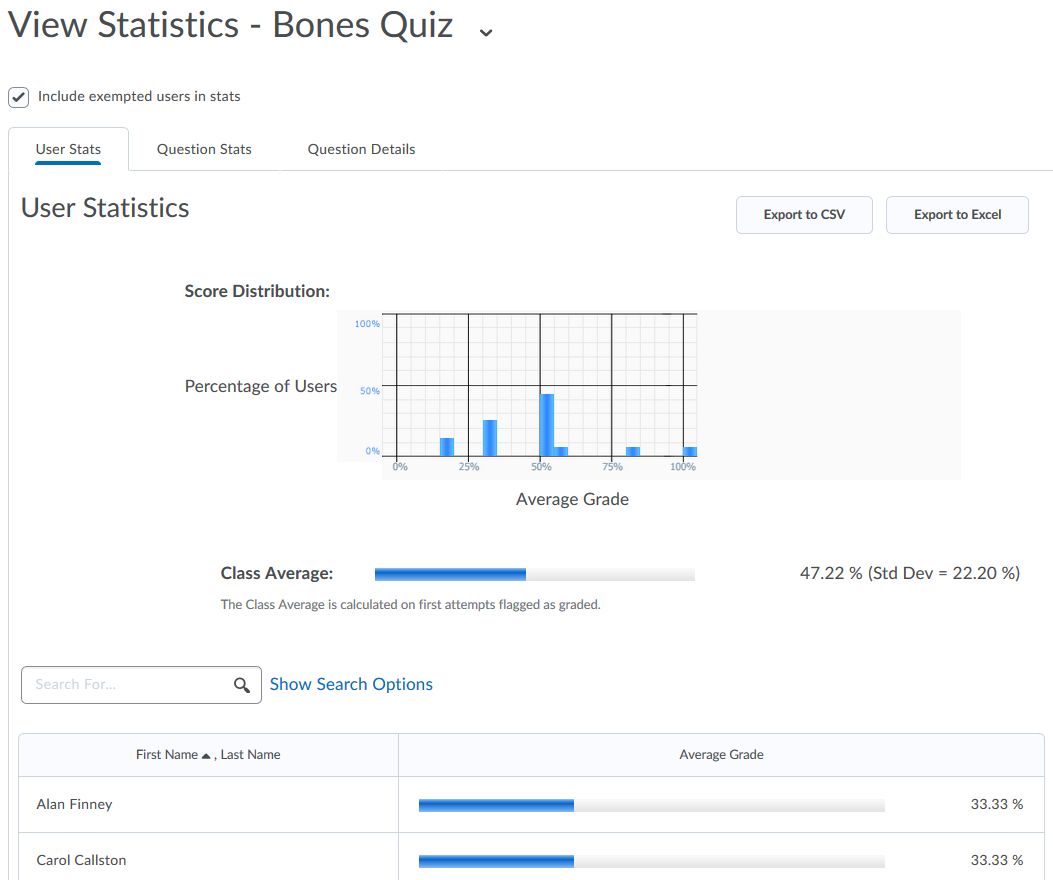
Understanding User Stats
User Stats CSV files contain performance data by user, including: the user’s Org Defined ID, username, first name, last name, quiz score, the value the quiz was graded out of, the user’s score as a percentage, and the class average.
Tip: Create a column to calculate the median score on the quiz to consider the class’s performance from a different perspective. Use the formula <=median(x1:x5)> to calculate the median.
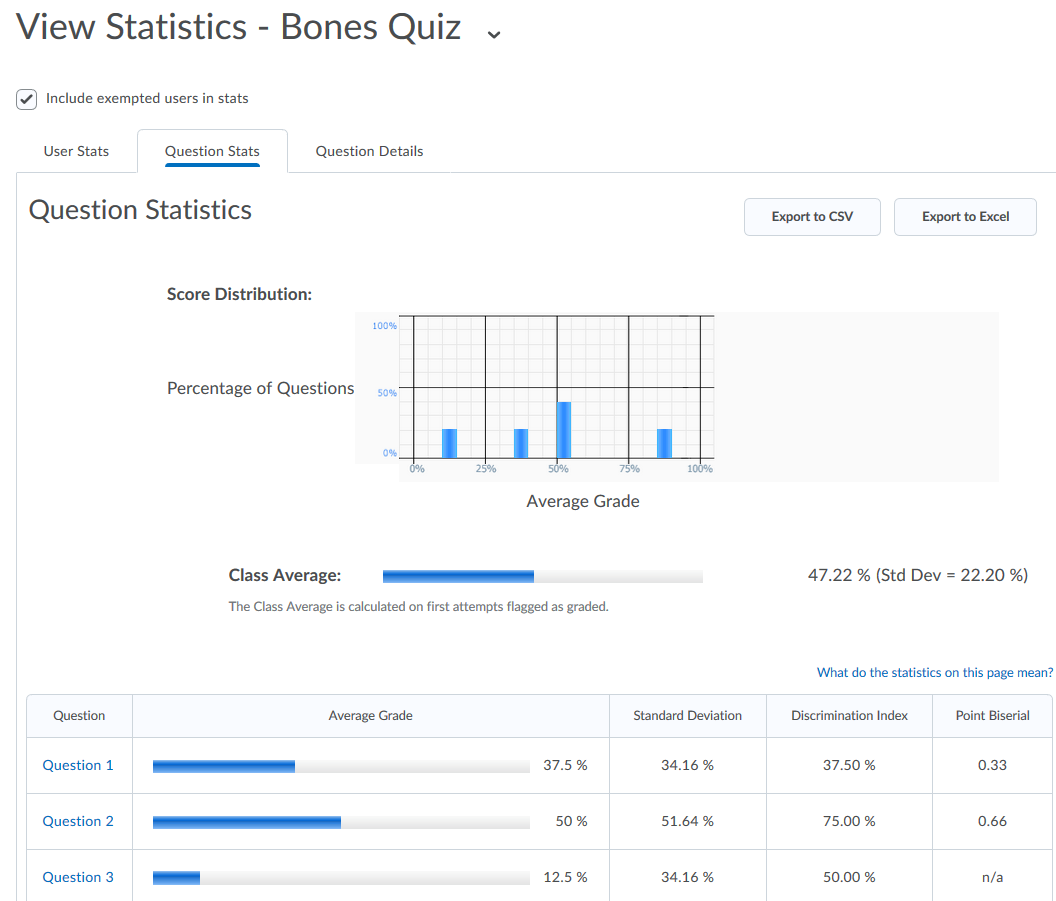
Understanding Question Stats
Question Stats CSV files contain data about the average score on questions by points and percentage.
The question title, text, bonus status, and difficulty level are included in the CSV file so that data can be analyzed without referring back to D2L Brightspace.
Tip: You can sort, query, hide, and delete data to help your analysis and create charts or graphs to visually represent trends.
Understanding Question Details
Question Details CSV files contain detailed information about each question in the quiz, including a list of all of the answers provided for each quiz attempt, how many users chose each possible answer, the total number of responses, and the average score on the question. Question Details reports can help you evaluate trends in answers and look for questions that were unclear or difficult for a number of users.
The question title, text, bonus status, and difficulty level are included in the CSV file so that data can be analyzed without referring back to D2L Brightspace.
Tip: Create a column that calculates the average score for all question attempts as a percentage by dividing the Average Score column by the Out Of column and multiplying by 100. Next, create a custom filter for the new Attempt Average column that displays only rows where the attempt average is less than 51%. This way you can quickly review questions that users struggled with and adjust grades or your lesson plans accordingly.
Data exported for question details
|
Question Type
|
What is exported
|
|
Multiple Choice
|
All of the possible answers and the number of responses for each answer.
|
|
True and False
|
All of the possible answers and the number of responses for each answer.
|
|
Written Response
|
All of the responses provided listed on separate rows.
|
|
Short Answer
|
The correct answer for each blank and an additional row for all other answers, and the number of responses for the correct answer versus other answers.
|
|
Multi-Short Answer
|
The correct answers for each blank and an additional row for all other answers, and the number of responses for the correct answer versus other answers.
|
|
Fill in the Blanks
|
The correct answers and an additional row for other answers, and the number of responses for the correct answer versus other answers.
|
|
Multi-Select
|
All of the possible answers and the number of responses for each answer.
|
|
Matching
|
All of the possible matches and the number of responses for each match.
|
|
Ordering
|
All of the answers in the order match and the number of responses for each match.
|
|
Arithmetic
|
Questions broken down by results and units. Also lists which users had both results and units correct, only results correct, only units correct, and neither correct.
|
|
Significant Figures
|
Questions broken down by results and units. Also lists which users had both results and units correct, both results and units correct as well as significant figures, only results correct, only results and significant figures correct, only units correct, and neither results or units correct.
|
Statistics by Question Type and Question Collection
Statistics are available for the following question types.
|
Question Type
|
Average Grade
|
Standard Deviation
|
Point Biserial
|
Discrimination Index
|
|
T/F
|
Yes
|
Yes
|
Yes*
|
Yes
|
|
M/C
|
Yes
|
Yes
|
Yes*
|
Yes
|
|
M/S
|
Yes
|
Yes
|
No
|
Yes
|
|
Matching
|
Yes
|
Yes
|
No
|
Yes
|
|
Ordering
|
Yes
|
Yes
|
No
|
Yes
|
|
WR
|
Yes
|
Yes
|
No
|
Yes
|
|
SA
|
Yes
|
Yes
|
No
|
Yes
|
|
MSA
|
Yes
|
Yes
|
No
|
Yes
|
|
FIB
|
Yes
|
Yes
|
No
|
Yes
|
|
2+2
|
Yes
|
Yes
|
No
|
Yes
|
|
x10
|
Yes
|
Yes
|
No
|
Yes
|
* Note: There can only be one answer worth 100%; all other answers must be worth 0%.
Question statistics are available for questions contained within quizzes using the following features.
|
Question Condition
|
Average Grade
|
Standard Deviation
|
Point Biserial
|
Discrimination Index
|
|
In Question Pool**
|
No
|
No
|
No
|
No
|
|
Quiz Shuffle**
|
Yes
|
Yes
|
Yes
|
Yes
|
|
In Folder Section
|
Yes
|
Yes
|
Yes
|
Yes
|
|
In Root section
|
Yes
|
Yes
|
Yes
|
Yes
|
|
Question has Randomized Response option
|
Yes
|
Yes
|
Yes
|
Yes
|
** Important: Questions contained in a Question Pool do not produce item analysis statistics. If appropriate for your quiz, you can randomize the question order of all questions using the Quiz Shuffle feature.
What are the available quiz statistics and where are they located?
Standard Deviation
- (Class) Standard Deviation – indicates how much the class scores vary from the average, ranging from 0% to 100%. A high standard deviation indicates that scores are spread out from the average, whereas a low standard deviation indicates that scores are close to the average. Note: Standard Deviation displays a "0.00" value when all users have the same quiz score.
- (Question) Standard Deviation – indicates how much the individual quiz question score varies from the average quiz question score. Standard deviation increases as less people answer a specific question correctly. Note: Standard Deviation displays a "0.00" value when all users give the same answer a specific question, correctly or incorrectly.
Discrimination Index
The Discrimination Index indicates how well a question differentiates between higher and lower performing students by subtracting the question's Lower 27% from its Upper 27%. The higher the difference, the better the question discriminates between high and low performing students. For example, the discrimination index on question 1 is 66.67%-50%=16.67%. It can range from -100% to 100%, with high values indicating a “good” question, and low values indicating a “bad” question.
Note: A negative value indicates that more low performing students are correctly answering the question than high performing students. This would most likely indicate a flawed quiz question.
Point Biserial
The Point Biserial calculates any possible correlation between the question score and the total quiz score. Similarly to the discrimination index, the point biserial correlation coefficient relates individuals’ quiz scores to whether or not they got a question correct. It measures the strength of the correlation between the two values, and shows either a positive or a negative relationship. It ranges from -1.00 to +1.00 with high values indicating a “good” question, and low values indicating a “bad” question.
Note: Point Biserial displays a "N/A" value when all users answer a specific question correctly.
User Stats, Question Stats, and Question Details
In Quiz Statistics, these statistics are available to assist instructors to evaluate how well students perform on quiz questions.
- User Stats tab - includes the standard deviation with the class average for the overall quiz.
-
- Question Stats tab - includes standard deviation, discrimination index, and point biserial per question, as well as the standard deviation with the class average for the overall quiz.
- Question Details tab - includes standard deviation, discrimination index, and average grade achieved per question.